Metrics#
In the Metrics tab in the project detail we can see a Summary Report for the whole questionnaire and then the same details for each individual chapter.
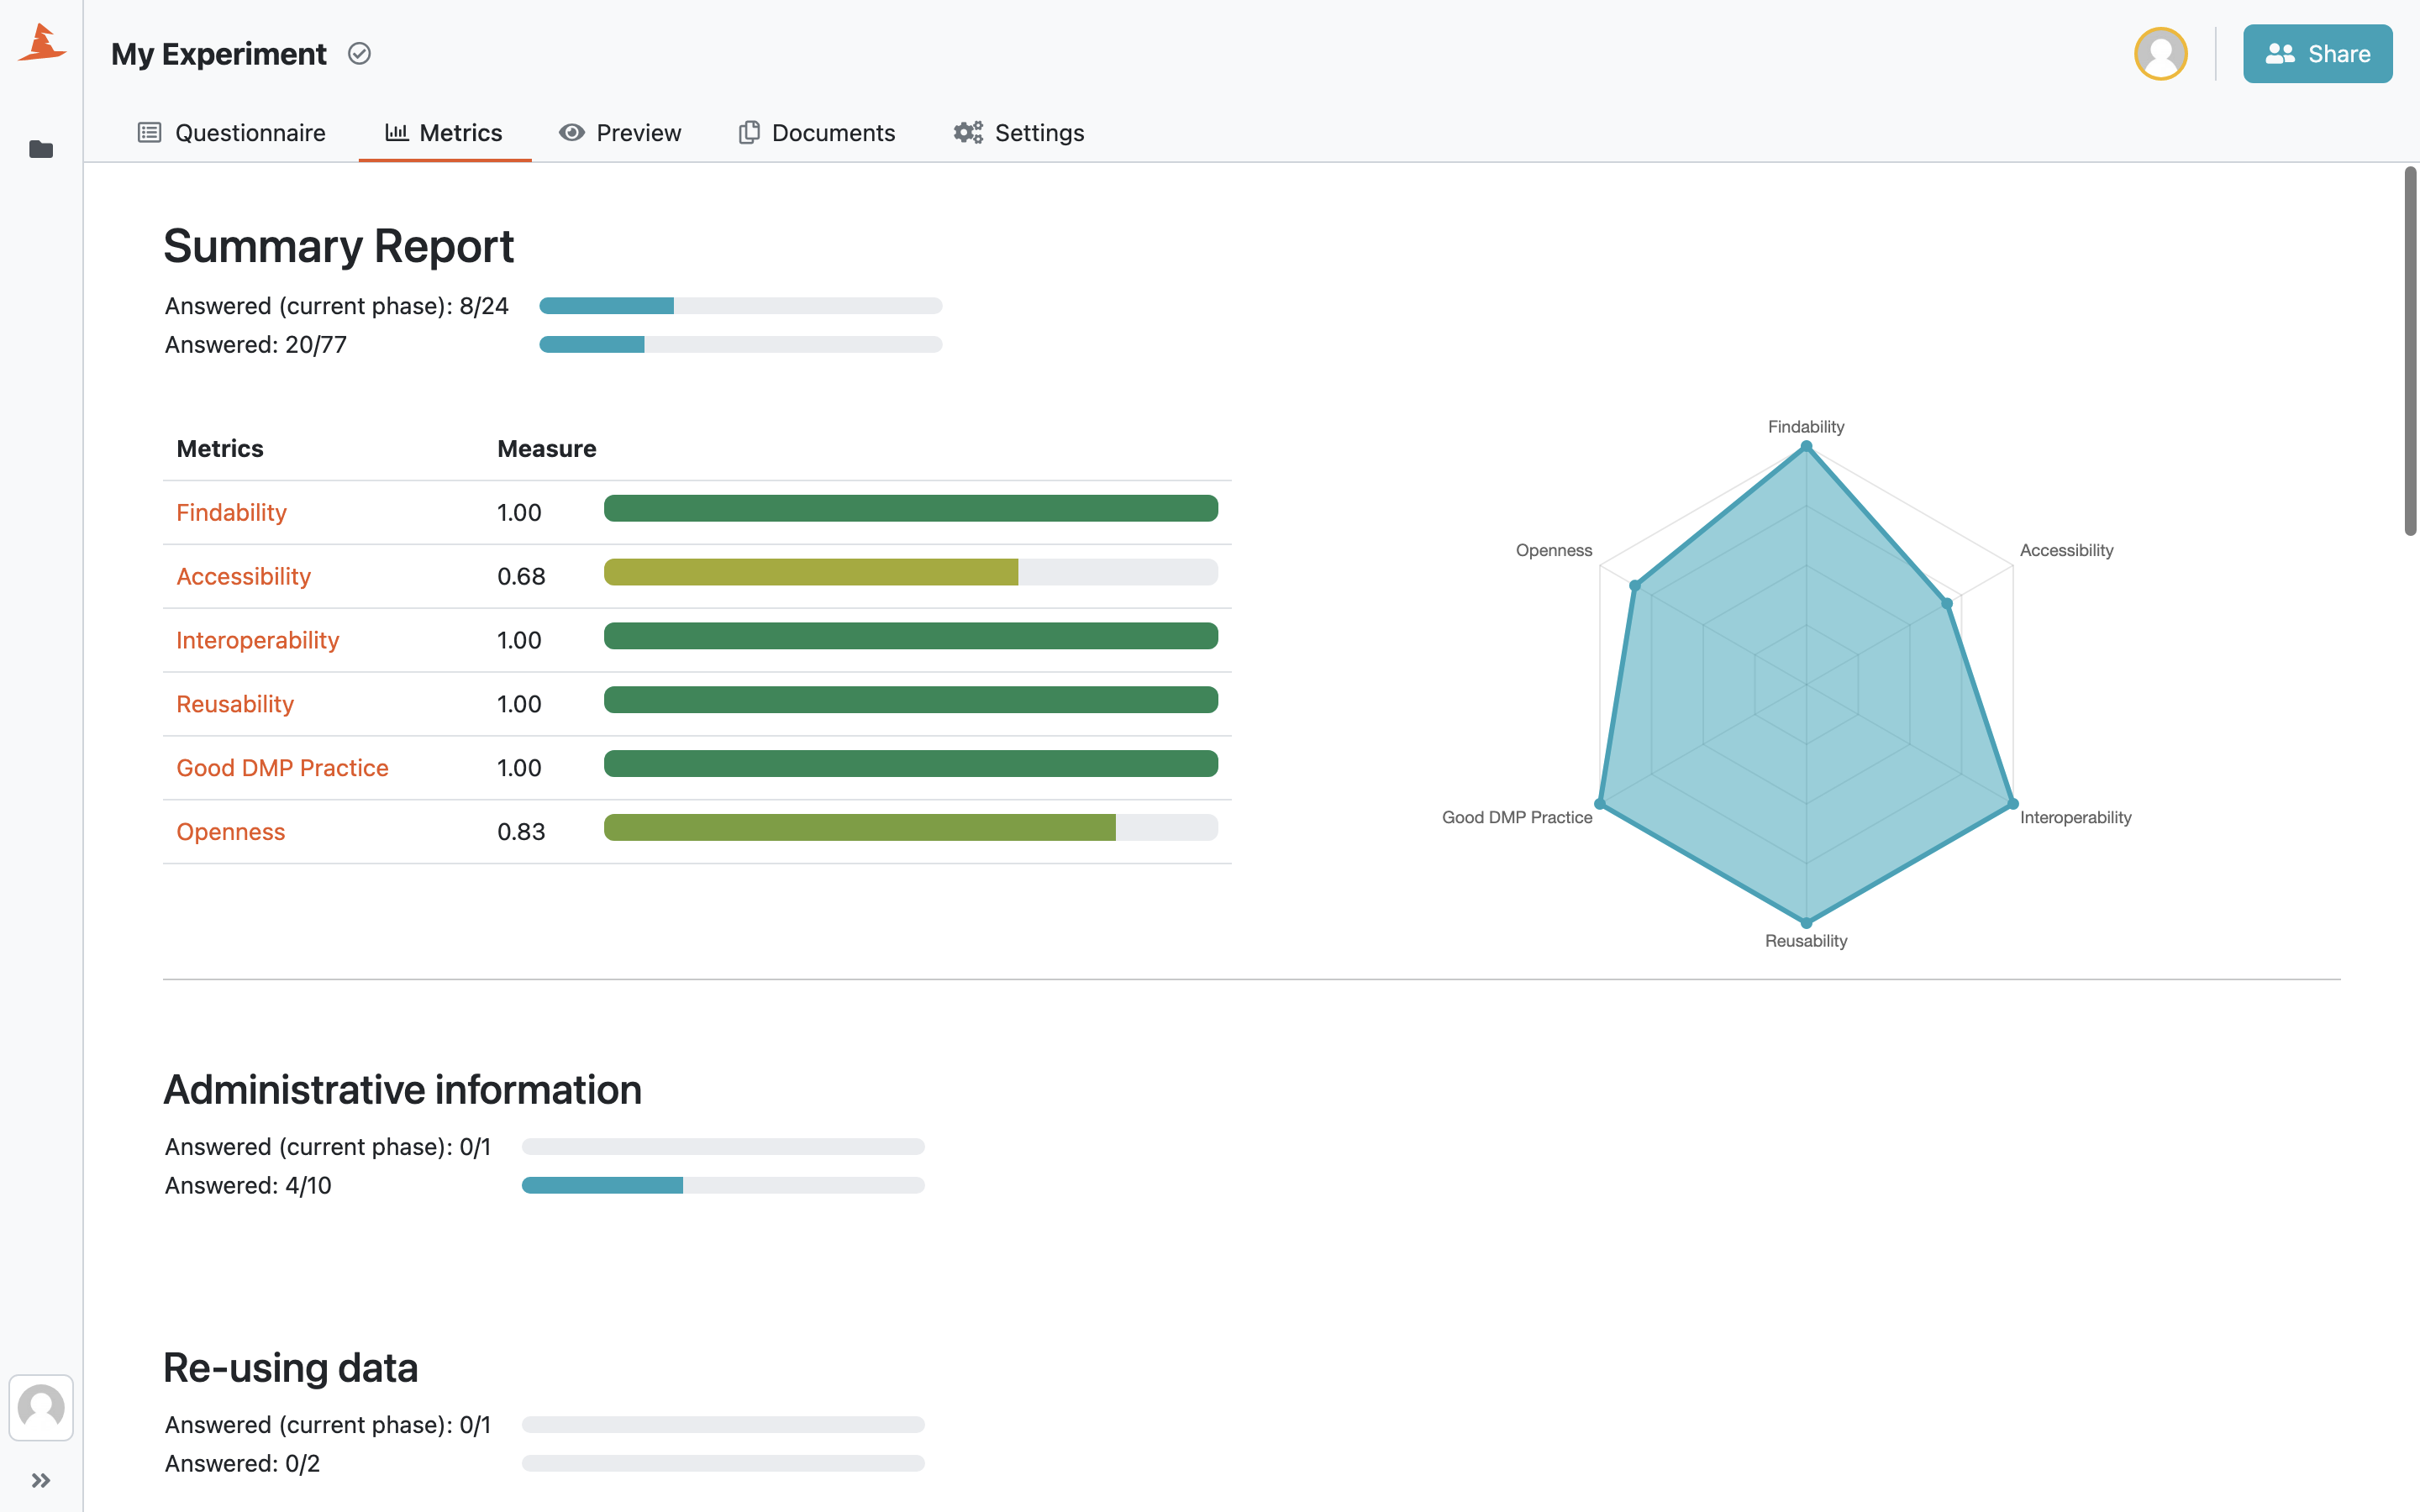
Summary report of project metrics.#
The report shows how many answered questions out of how many are there for the current phase (if there are phases in the knowledge model) and overal.
If there are any metrics in the knowledge model, the report also shows the score for each metric. The score is calculated as a weighted average of all the answers affecting that metric and is always between 0 and 1. If there are at least 3 metrics present, a spider chart is also displayed.
There is also a metrics description at the bottom of the page to better understand what exactly each metric means.